Start Saving with Solar
How to Save with Solar
Solar power systems are hugely popular in Australia, and their popularity is still growing. Most homeowners are drawn in by the drastically reduced electricity costs. But many are also swayed by the reduced impact on the environment and a lessened reliance on the grid.
Whatever the reason, solar power is the future. And it’s one that will give you big returns. The trick is to invest early and use it well into the future.
Big Returns
At the end of the day, we’re all looking for ways to reduce our electricity costs. Costs are on the rise. And consumption is as well as we bring in more and more electric vehicles and other carbon reducing technologies.
Solar power is the answer. You only have to look at the numbers.
Potential Solar System Savings
| System Size | Average Solar Daily Output | Cost of Power | Potential Annual Savings** |
|---|---|---|---|
| 5kW | 20 kWh | 25 cents | $2,190 |
| 6kW | 25 kWh | 25 cents | $2,500 |
| 8kW | 32 kWh | 25 cents | $3,500 |
| 10kW | 42 kWh | 25 cents | $4,380 |
**Assumes full year-round utilisation of generated electricity, and will change based on usage and feed-in tariffs.
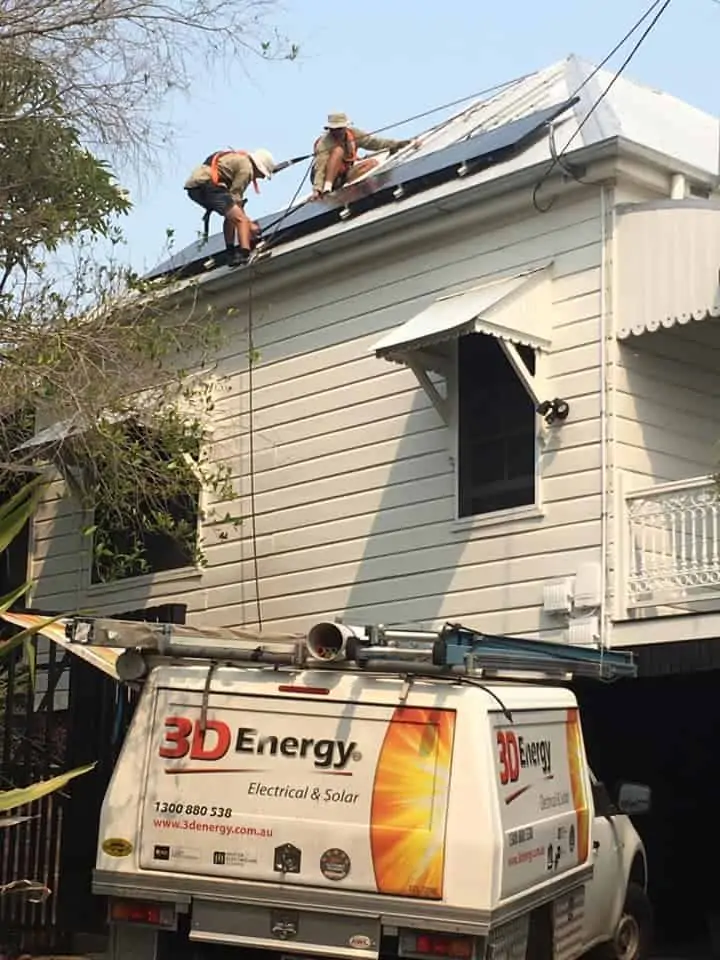
Case Study: Typical Residential Solar
System—6.66kW*
Of course, every household is different, but the average Australian household uses from 15 kWh to 24 kWh per day. A 6.66kW system can generate up to 27 kWh of power every day. Which means you can live your life nearly (electricity) cost free.
Here we installed a 6.66kW system on a home in Ipswich, Queensland. The system dropped the customer’s annual electricity bill from around $1,500 per year, to less than $200 per year—a reduction of a whopping 87%. And a typical result for this size and type of system.
Projections
DAILY PRODUCTION PER MONTH
Of course, every household is different, but the average Australian household uses from 15 kWh to 24 kWh per day. A 6.66kW system can generate up to 27 kWh of power every day. Which means you can live your life nearly (electricity) cost free.

| UTILITY COSTS | BEFORE SOLAR | WITH SOLAR | |||
|---|---|---|---|---|---|
| Average monthly bill | $121.26 |
|
|||
| Annual bill | $1,455.12 |
|
|||
20 Year Financial Outlook
| Present Day Value of Investment | $20,210.46 |
| Payback Period | 3-3.5 years |
| Total Return on Investment | 520% |
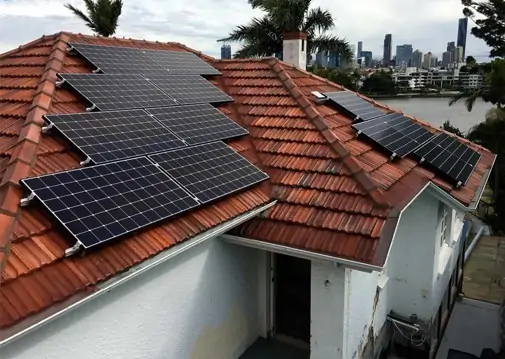
Case Study: Large Residential Solar System—10.73kW*
If you live in a home that consumes more energy—perhaps because you also run your workshop from the property, operate heavy equipment or simply have a large home with a lot of appliances—you may need a larger solar system. The 10.73kW system can generate 44 kWh of power to help you run everything you need to from your home.
We installed a 10.73kW system in a home like this in Indooroopilly, Queensland. And the customer saw an immediate and immense drop in their annual electricity—from an estimated $3.279 before solar, to around $445 after solar.
This is a savings of 86%, every single year.
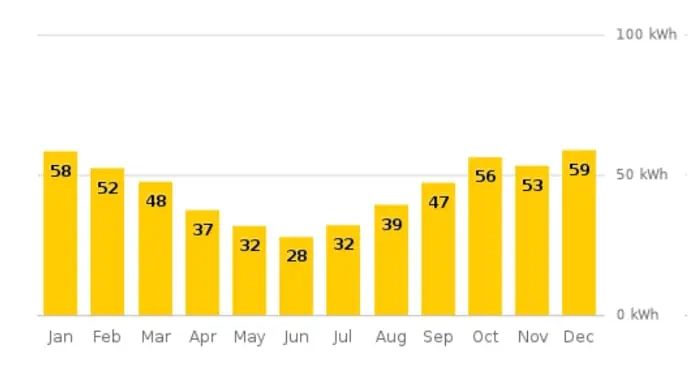
Projections
DAILY PRODUCTION PER MONTH
The 10.73kW system can generate 44 kWh of power to help you run everything you need to from your home.
| UTILITY COSTS | BEFORE SOLAR | WITH SOLAR | |||||
|---|---|---|---|---|---|---|---|
| Average monthly bill | $273.27 |
|
|||||
| Annual bill | $3,279.22 |
|
|||||
20 Year Financial Outlook
| Present Day Value of Investment | $50,415.22 |
| Payback Period | 3.5 years |
| Total Return on Investment | 507% |
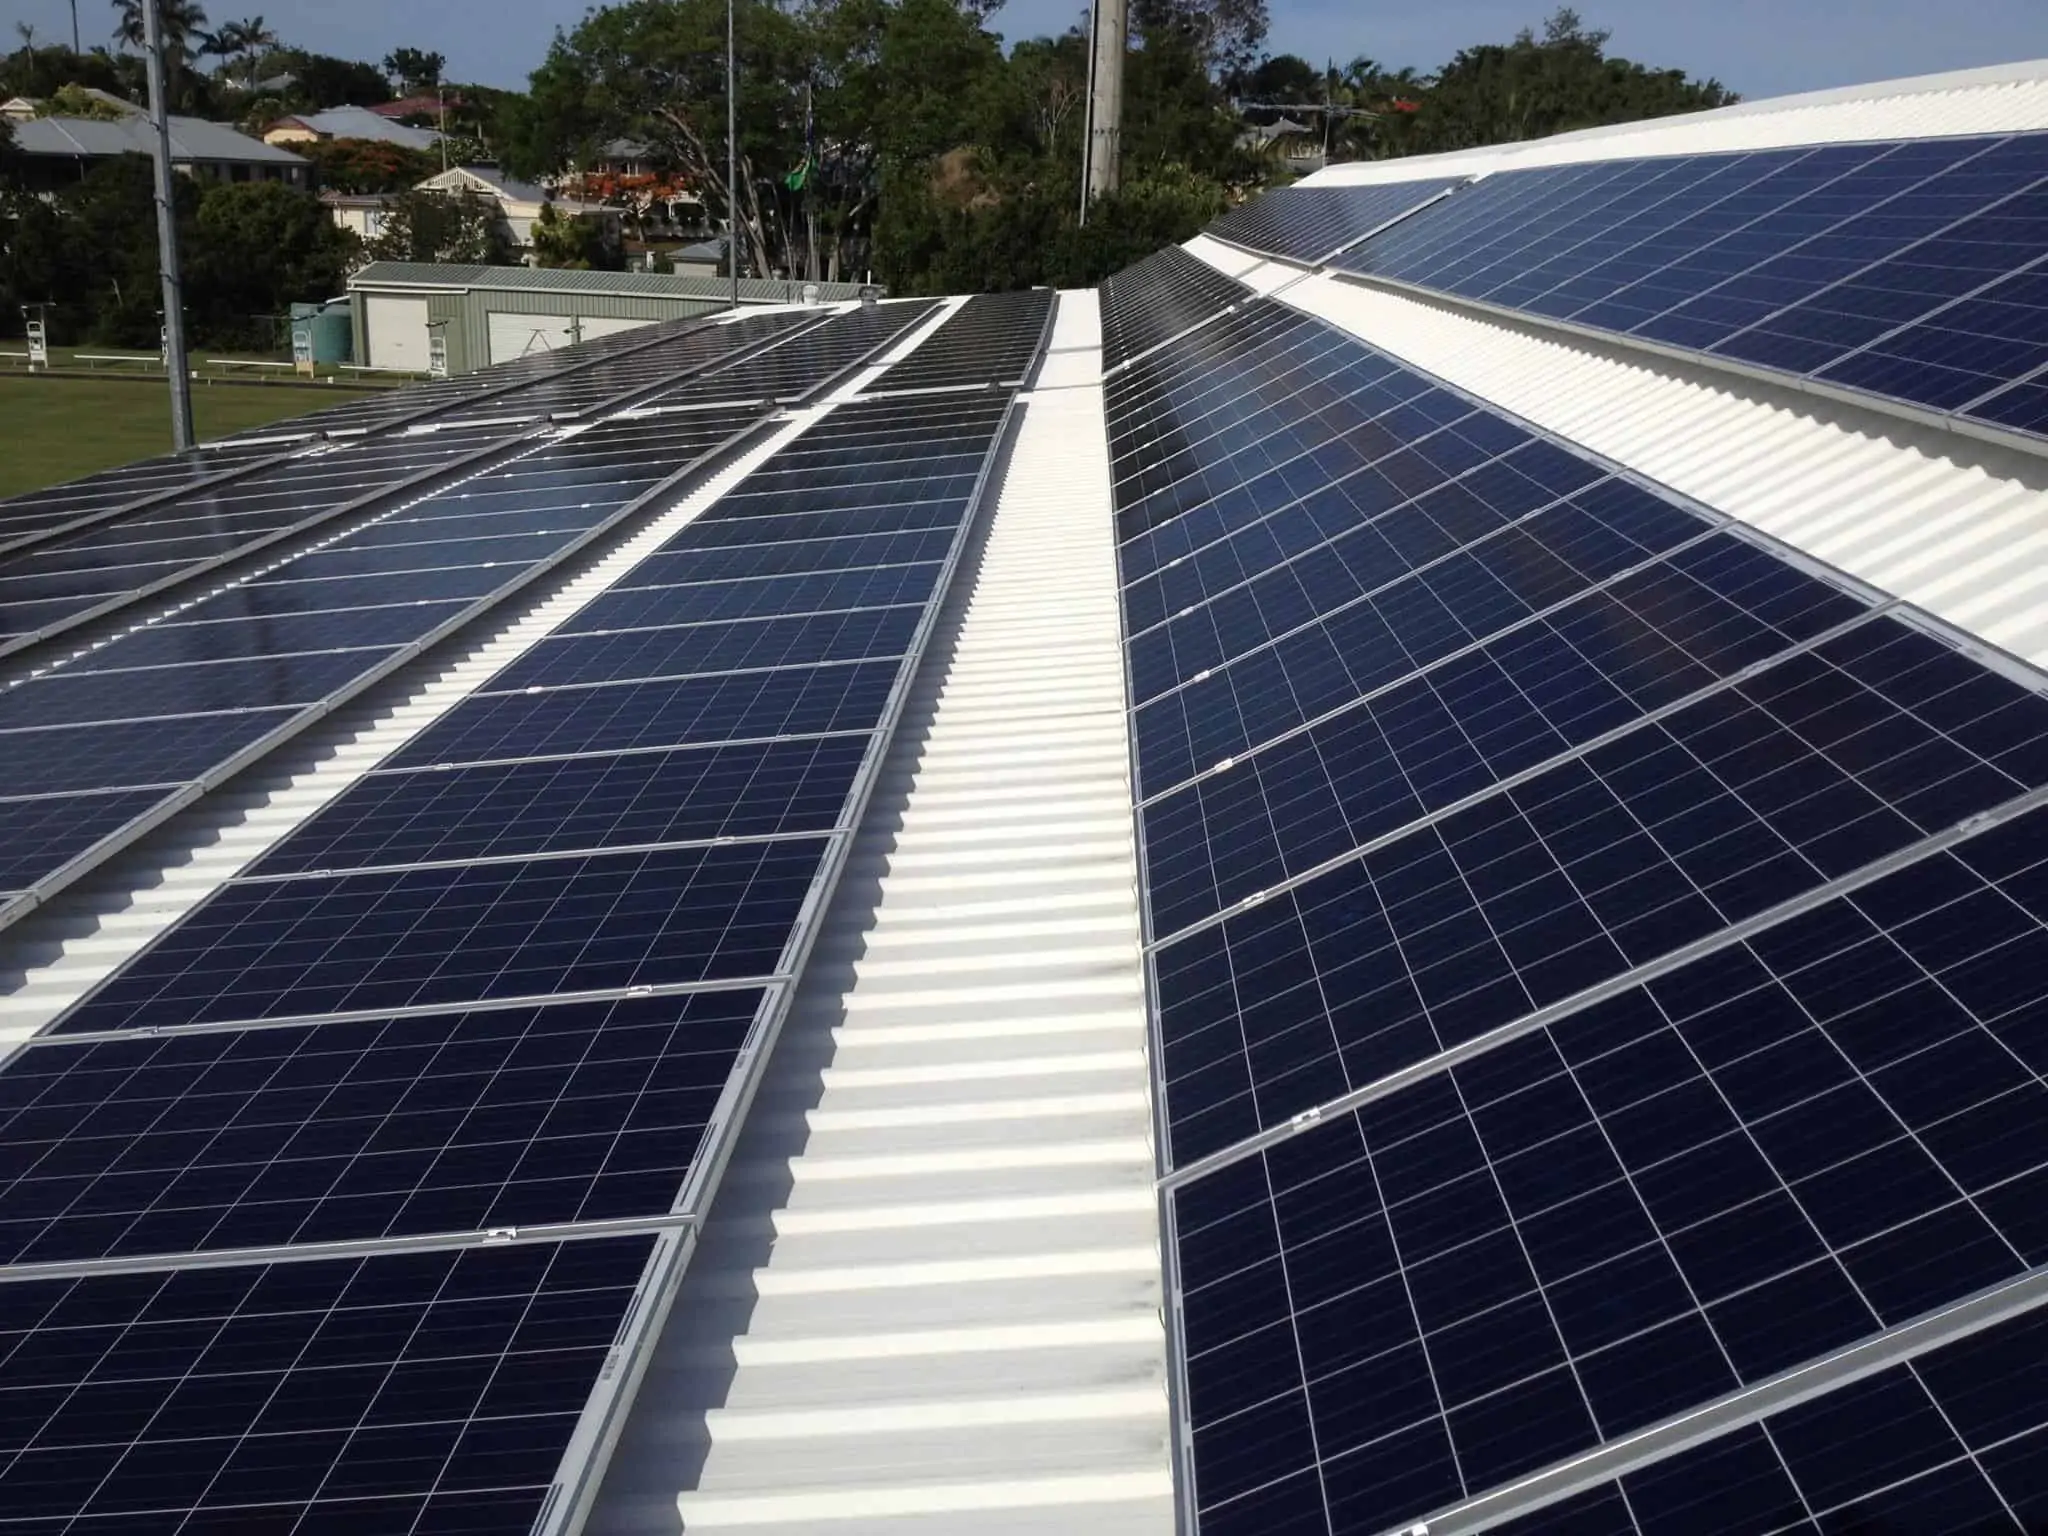
Case Study: Commercial Solar System—38.25kW*
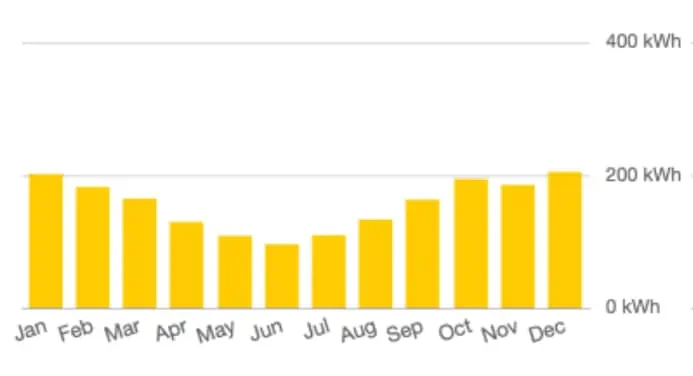
If you have a commercial property, solar should be one of your first investments. With a 38.25kWh system, you’ll generate between 100 and 200 kWh of electricity each day (on average). And your monthly and annual electricity bill will plummet by an estimated 76%.
We installed a 38.25kW solar system on a commercial property in Chermside, Queensland. The customer experienced these excellent results, and more.
Projections
DAILY PRODUCTION PER MONTH
With a 38.35kWh system, you’ll generate between 100 and 200 kWh of electricity each day (on average). And your monthly and annual electricity bill will plummet by an estimated 76%.
| UTILITY COSTS | BEFORE SOLAR | WITH SOLAR | |||||
|---|---|---|---|---|---|---|---|
| Average monthly bill | $1,148.14 |
|
|||||
| Annual bill | $13,777.73 |
|
|||||
20 Year Financial Outlook
| Present Day Value of Investment | $196,948.36 |
| Payback Period | 2-3 years |
| Total Return on Investment | 804% |
Feel Good Electricity
Solar doesn’t just help you save costs—it also helps you save on costs to the environment. These savings come primarily from avoiding power plant emissions, as well as fuel consumption.
MONTHLY ELECTRICITY BILL COMPARISION
- Electricity bill without solar
- Electricity bill with solar

6.6kW Solar System
Trees Planted Equivalent
159 trees per year 5
Each tree icon represents 20 trees

Fuel Consumption Saved
2645 litres of petrol per year 5
Each fuel can icon represents 2700 litres of fuel

Coal Burning Saved
3006 kg of coal per year 5
Each coal lump icon represents 310 kg of coal

10.73kW Solar System
Trees Planted Equivalent
290 trees per year 5
Each tree icon represents 30 trees

Fuel Consumption Saved
4822 litres of petrol per year 5
Each fuel can icon represents 490 litres of fuel

Coal Burning Saved
5480 kg of coal per year 5
Each coal lump icon represents 550 kg of coal

38.25kW Solar System
Trees Planted Equivalent
1026 trees per year 5
Each tree icon represents 110 trees

Fuel Consumption Saved
17040 litres of petrol per year 5
Each fuel can icon represents 1710 litres of fuel

Coal Burning Saved
19366 kg of coal per year 5
Each coal lump icon represents 1940 kg of coal

Grid Independence
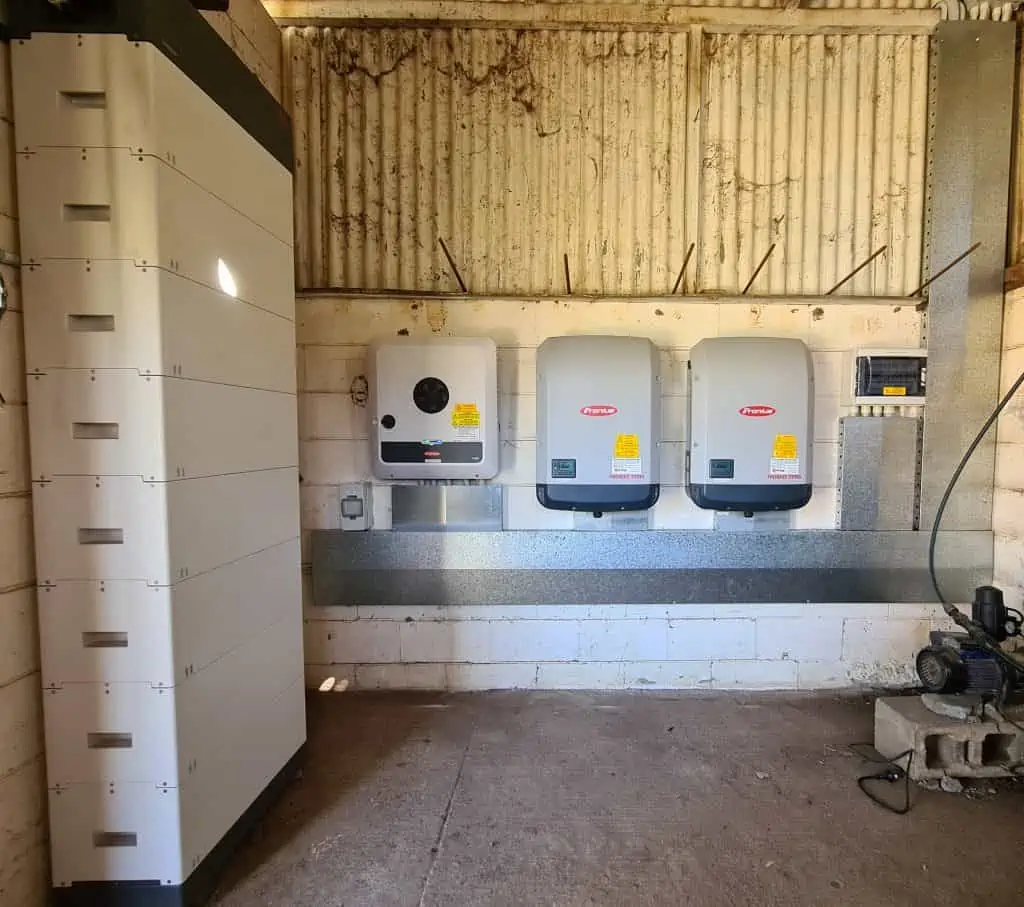
Many of our solar customers want to understand how they can eliminate the costs of relying on the grid for any power at all. Some businesses have vital equipment that they need to keep powered up in the case of a blackout. Other people simply want to be able to use all the power they produce.
In these cases a battery is a great choice. Battery costs are coming down, and they’ll continue to come down over time.
Battery Cost Savings Projections*
| Assumed battery cost | $70,500 |
| Storage Capacity | 12.8kWh |
| Battery Use | 100% |
| Grid electricity use | 0% |
| Payback period | 6-7 years |
While these are huge savings, what’s even more important to customers is the total removal of any worries about grid outages or rising electricity costs. Instead, they have complete electricity independence.
Case Study: Residential Solar System with Battery Storage*
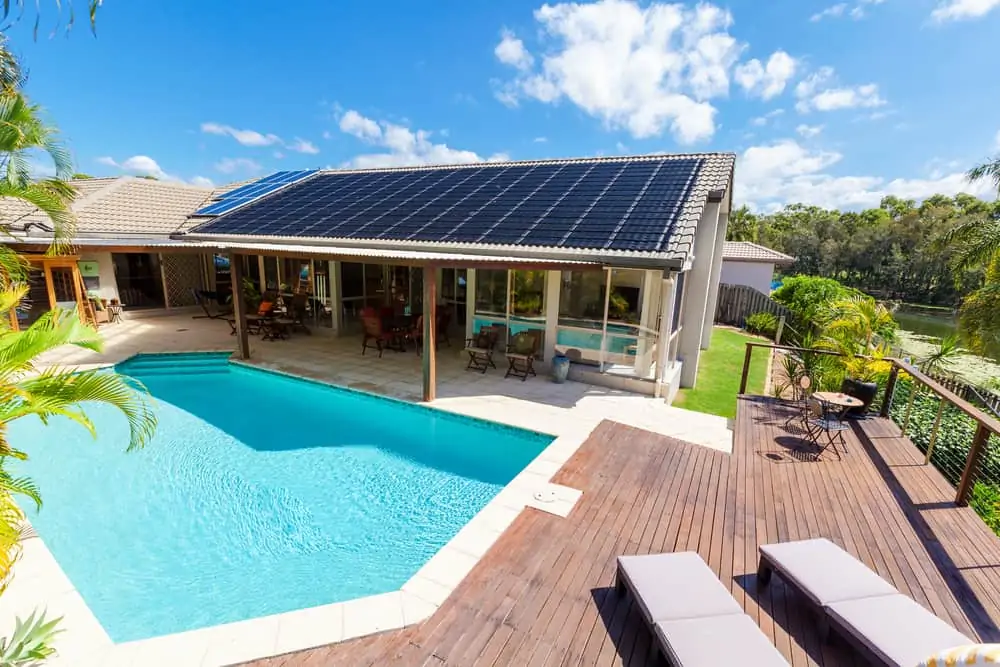
This residential property had a pool, pool heater, ducted air conditioning and many other appliances on site resulting in an energy bill pushing $5,000 annually. The proposed solution included a 13.3 kW solar system with two Sungrow Inverters and 12.8kWh Sungrow battery.
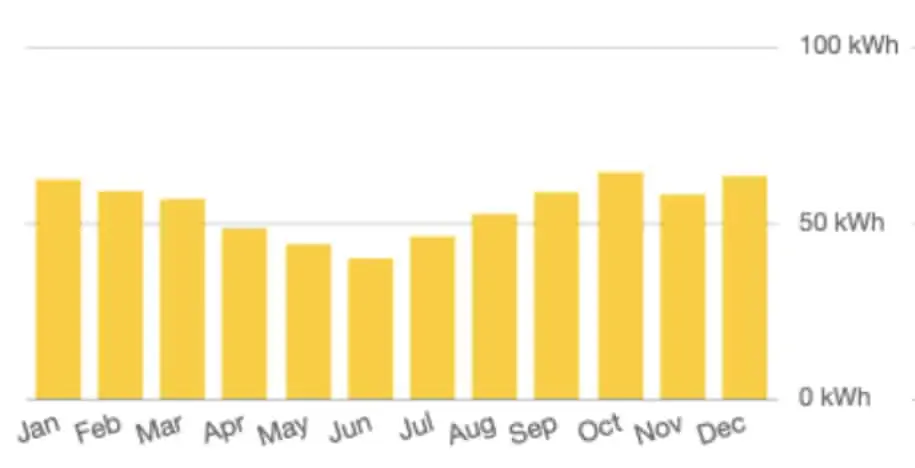
This system will generate an average of 50 kWh of electricity per day, lowering the annual bill from nearly $5,000 to $1,266, a savings of 73%.
Projections
DAILY PRODUCTION PER MONTH
Better yet, with a battery system, the home owner will be consuming 63% of their solar power production on site, which is up from 42% with just solar panels—a fantastic result.
| UTILITY COSTS | BEFORE SOLAR | WITH SOLAR | |||||
|---|---|---|---|---|---|---|---|
| Average monthly bill | $389.65 |
|
|||||
| Annual bill | $4,675.76 |
|
|||||
Where will your solar come from?
| SOLAR | STORAGE | UTILITY |
|---|---|---|
| 43% | 22% | 35% |
| SELF CONSUMPTION | SOLAR ONLY | WITH STORAGE | |||
|---|---|---|---|---|---|
| How much of your solar bill will be consumed on-site. More is better | 42% |
|
20 Year Financial Outlook
| Present Day Value of Investment | $51,884.13 |
| Payback Period | 6-7 years |
| Total Return on Investment | 238% |
Trees Planted Equivalent
357 trees per year 5
Each tree icon represents 40 trees

Fuel Consumption Saved
5938 litres of petrol per year 5
Each fuel can icon represents 600 litres of fuel

Coal Burning Saved
6749 kg of coal per year 5
Each coal lump icon represents 680 kg of coal

Tips to Get the Most Out of Your Solar
1. Timing is everything. Learn how to set the timers on your dishwasher, washing machine and other appliances when the solar panels can help. And develop a habit of charging your devices, including any electric vehicles, while the sun is shining.
2. Keep it on an even keel. When it comes to heating and cooling the house, try to adjust the temperature of your home as much as possible during the daylight hours.
3. Upgrade! When it comes to appliances, the old mixer mum left you might not be the best choice in terms of power usage. Instead, look to upgrade to models that have high EECA ENERGY STAR ratings. They’ve been designed to use as little energy as possible.
4. Get smart. Smart home technologies are taking Aussie homes by storm. With smart tech you can control the lights, thermostats and even the shades of your home all from your smartphone. And save energy at the same time.
3D Energy - Brisbane Solar Power Experts
At 3D Energy we can design the optimal cost-saving and power maximising solar system to suit your home or commercial property’s unique needs. We’ll ensure that you start saving now with high-quality products that are primed and ready to meet all your future solar needs.
3D Energy—Your Local Solar Experts
*All figures are a guide only. Each installation will generate different results as a result of differences in the materials, labour time, battery choices and other factors.
**To be used as a guide only. Potential savings assumes full year-round utilisation of solar power generated, and will change based on usage and feed-in tariffs.

